STOCKS-to-use ratios are often used when assessing global grain balance sheets as it provides an measure of how much grain we have on hand, versus how quickly we are using it.
Subscribe now for unlimited access to all our agricultural news
across the nation
or signup to continue reading
It is always important to look at the headline numbers of stocks-to-use, but it is also worthwhile to delve into the data to get a better understanding of the marketing situation.
The global picture for wheat is important, but it doesn't necessarily tell you too much.
Not all wheat is available, i.e. more than 50 per cent of wheat is held in China.
This is generally not available to the marketplace (if it exists at all).
One of the most important factors to examine is the situation of the exporters.
This is the wheat which will be available to the world.
The wheat available through exporters is dropping.
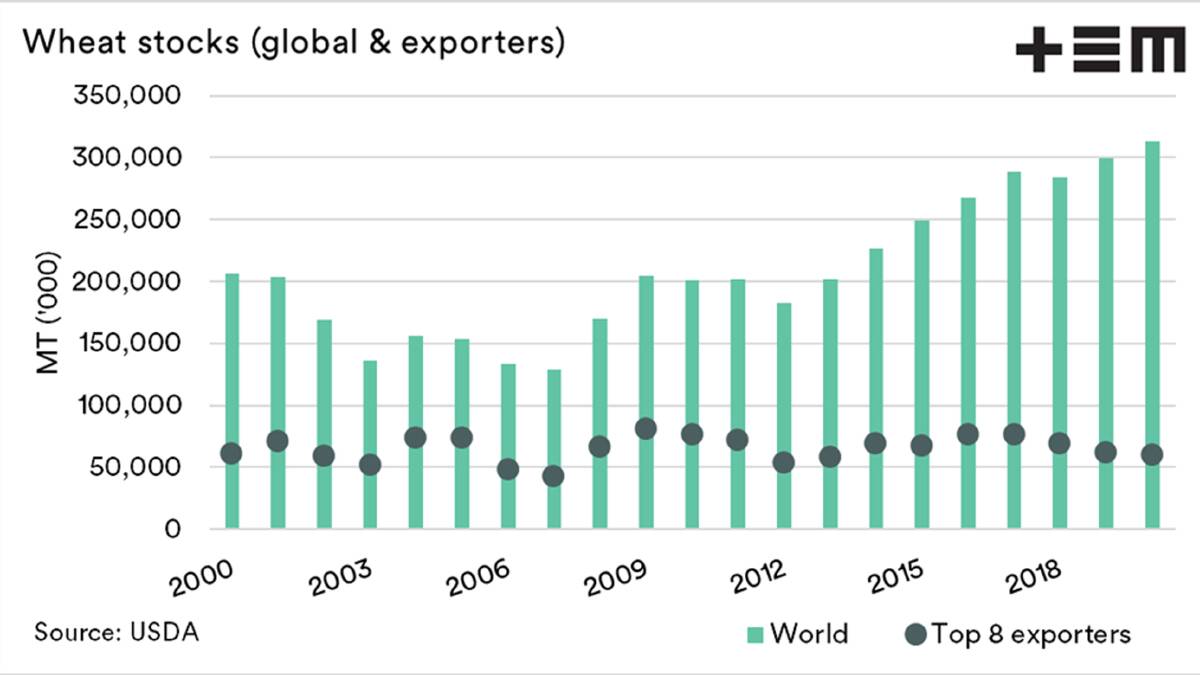
In chart 1 (above), the world stocks of wheat are displayed along with the exporters' stocks.
In the past decade, world stocks have risen to record levels.
A large proportion of this (on paper) is within China.
The situation with exporters has seen stock levels drop to the lowest level since 2013.
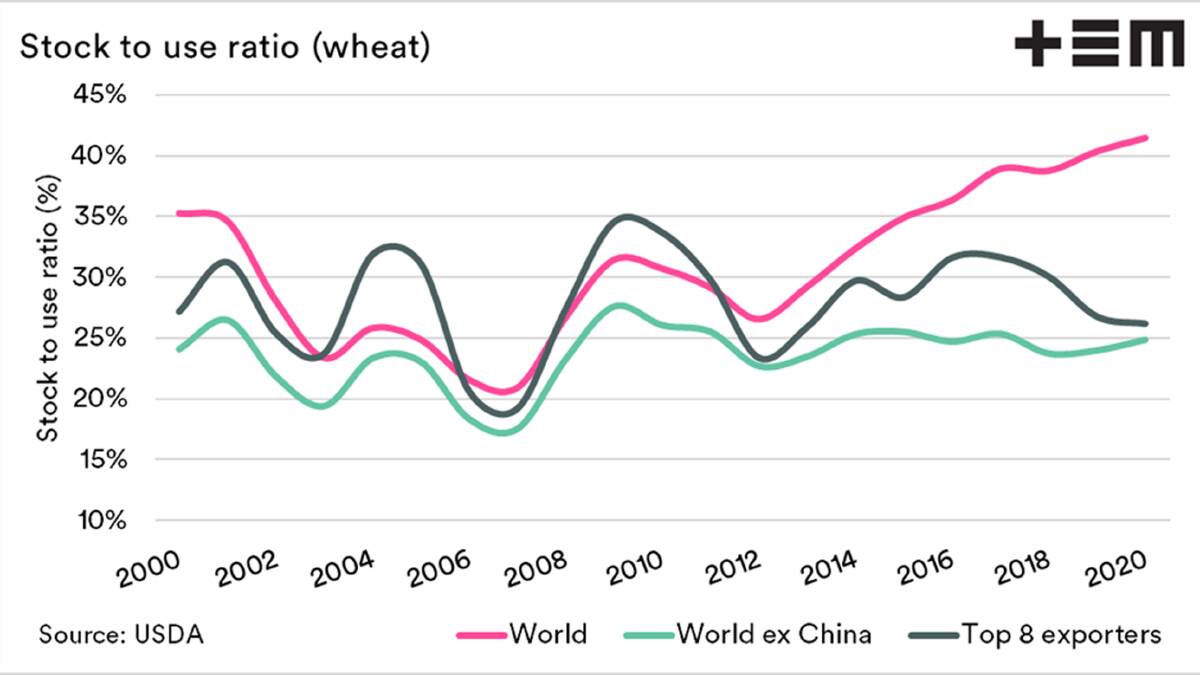
Chart 2 (below) displays the stock-to-use of the world and the stocks to use of the top eight exporters.

The stocks-to-use of the top eight exporters has dropped a couple of per cent since mid-October.
As the stocks-to-use of exporters declines, this is bullish for markets.
It reduces the available wheat to meet global import demand.
- More information: email thomaseldermarkets.com.au

