THIS period of the year is when the northern hemisphere crop is either growing or harvested.
Subscribe now for unlimited access to all our agricultural news
across the nation
or signup to continue reading
It is a time when there is great uncertainty.
The crop can improve and become a bumper, conversely, it can deteriorate.
If it declines, then look for excitement in the grain markets.
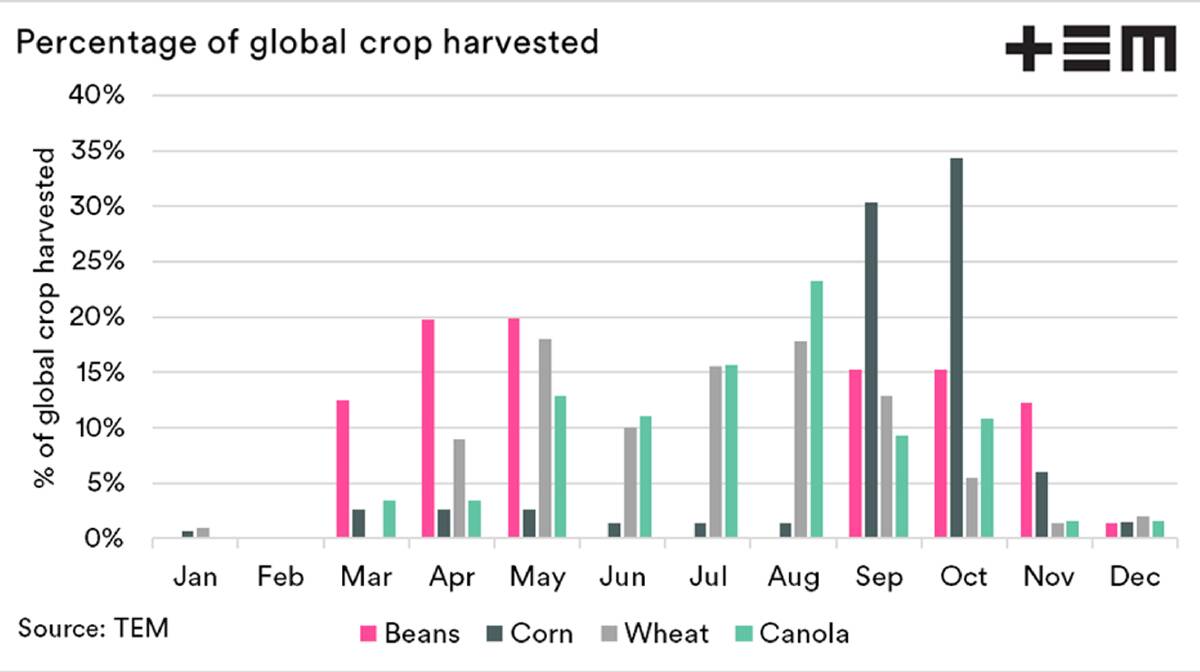
Chart 1 provides an illustration of when grains around the world are harvested each year.
A question we often receive is "what does this seasonality mean for pricing?".
It's worthwhile looking into when the peak and troughs are for the wheat market.
Grain producers should be thinking strategically regarding their selling.
That should at least include understanding the futures market and its impact upon pricing, even if not using derivatives to market your grain.
We have found many times when the market rallies but quickly loses its steam.
At times a concern can drive the market, pushed by speculators, and then find that the problems were overdone.
Where has the peak been?

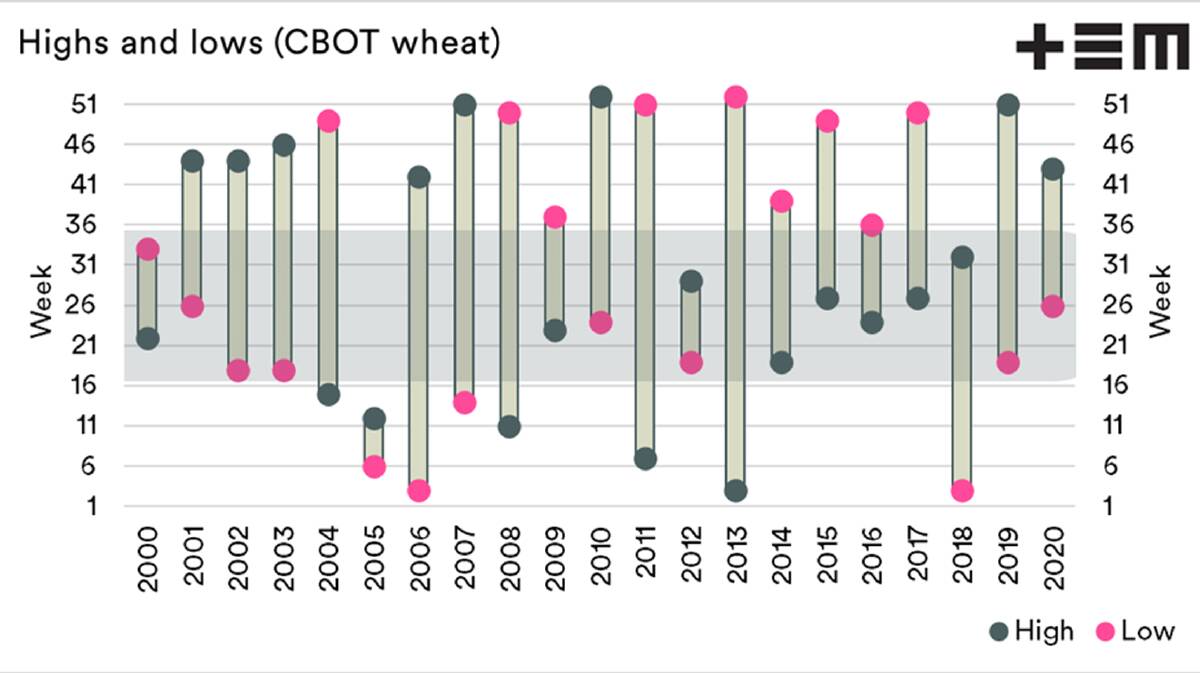
Chart 2 shows the highs and lows for Chicago Board of Trade (CBoT) wheat (spot) for each year between 2000 and 2020.
The peaks are shown as a grey circle and the lows as a pink circle.
Throughout the majority of the period since 2010, the peak has been during the middle of the year.
The past two years have reversed this trend.
Notably, the lows, have trended over the past decade towards the end of the year.
It is also worthwhile looking at the longer term.

Chart 3 displays the period 1975-present.
This data is displayed in five-year blocks.
On average, the peaks (and troughs) tends to be located in the middle of the year between June and August.

