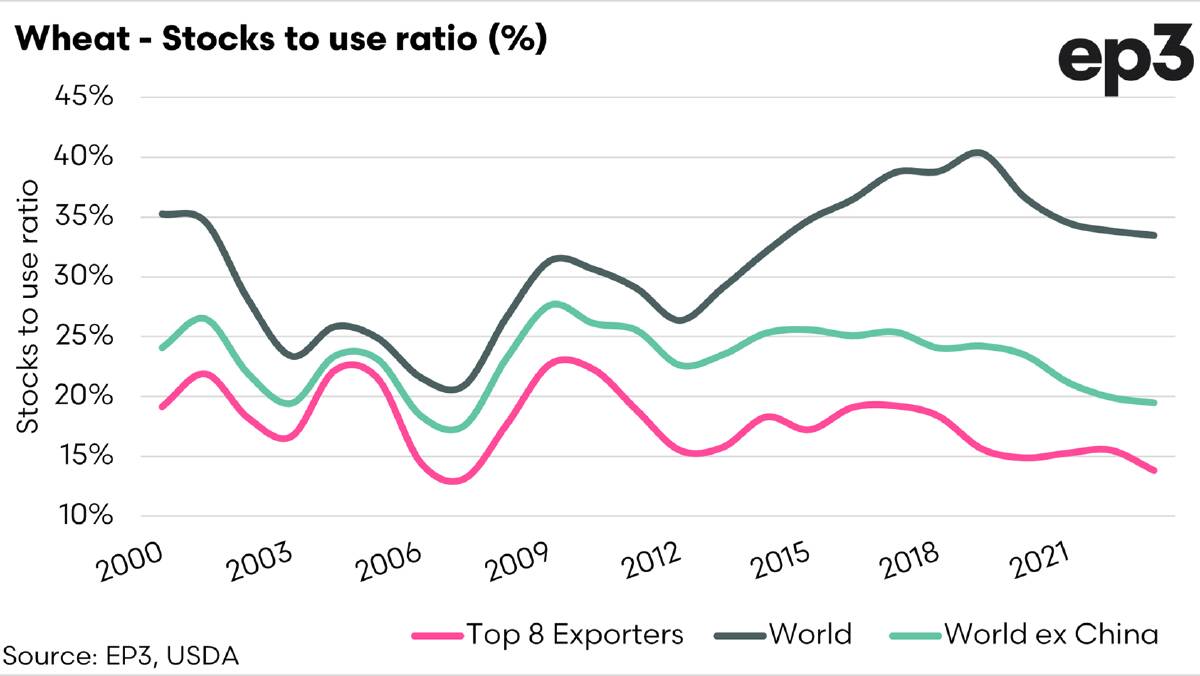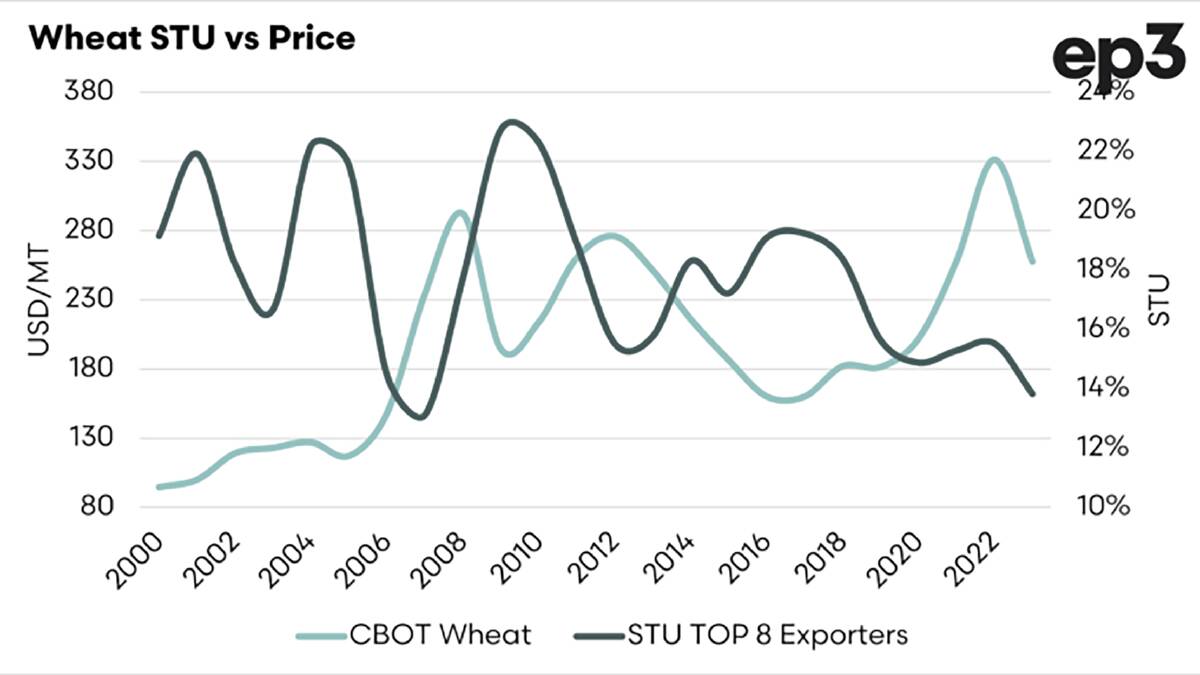
THE stocks-to-use is probably the best measure for assessing grain supply and demand, as it takes into account both sides of the equation.
Subscribe now for unlimited access to all our agricultural news
across the nation
or signup to continue reading
It is important to delve into the data.
If we look at the world stocks-to-use (STU) ratio, then we are pretty well supplied.
The real important part is where the available supply is held.
At EP3 we tend to look at eight countries which trade the majority of the world's wheat.
This gives an idea of what is available to the world's deficit countries.
READ MORE:
Currently, the STU of the world's major exporters is just below 14 per cent, which puts it at the lowest since 2007.
It is important to also take into account that the Ukraine issue is still live - will they/won't they be able to export grain via vessel this season?
Global wheat stocks remain high compared to history, at 266 million metric tonne, but this is well below the peak from 2019 at 298mmt.
The top eight exporters' stocks stayed relatively flat in recent years but have fallen in recent years to 55mmt, which is the lowest since 2012.
The global stocks are not spread equally.

If we drill down into the figures, China and India combined hold 57pc of the world's wheat supply.
Whether that exists and in what quality is another question.
In the case of China, this is unlikely to make it onto the global market.
While globally wheat stocks remain high, the reality is that the world's available wheat by virtue of the surplus nations, such as ourselves, is becoming tighter.
We always say the middle of the year makes the grain price.
If we see a major issue in one (or more) of the major exporters this year, then we could see fireworks as available supplies start to diminish.

